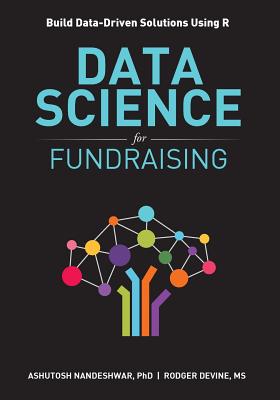
Data Science for Fundraising: Build Data-Driven Solutions Using R

Data Science for Fundraising: Build Data-Driven Solutions Using R
Discover the techniques used by the top R programmers to generate data-driven solutions.Although the non-profit industry has advanced using CRMs and donor databases, it has not fully explored the data stored in those databases. Meanwhile, the data scientists, in the for-profit industry, using sophisticated tools, have generated data-driven results and effective solutions for several challenges in their organizations.Wouldn't you like to learn these data science techniques to solve fundraising problems?After reading Data Science for Fundraising, you can:
✔ Begin your data science journey with R
✔ Import data from Excel, text and CSV files, and databases, such as sqllite and Microsoft's SQL Server
✔ Apply data cleanup techniques to remove unnecessary characters and whitespace
✔ Manipulate data by removing, renaming, and ordering rows and columns
✔ Join data frames using dplyr
✔ Perform Exploratory Data Analysis by creating box-plots, histograms, and Q-Q plots
✔ Understand effective data visualization principles, best practices, and techniques
✔ Use the right chart type after understanding the advantages and disadvantages of different chart types
✔ Create beautiful maps by ZIP code, county, and state
✔ Overlay maps with your own data
✔ Create elegant data visualizations, such as heat maps, slopegraphs, and animated charts
✔ Become a data visualization expert
✔ Create Recency, Frequency, Monetary (RFM) models
✔ Build predictive models using machine learning techniques, such as K-nearest neighbor, Naive Bayes, decision trees, random forests, gradient boosting, and neural network
✔ Build deep learning neural network models using TensorFlow
✔ Predict next transaction amount using regression and machine learning techniques, such as neural networks and quantile regression
✔ Segment prospects using clustering and association rule mining
✔ Scrape data off the web and create beautiful reports from that data
✔ Predict sentiment using text mining and Twitter data
✔ Analyze social network data using measures, such as betweenness, centrality, and degrees
✔ Visualize social networks by building beautiful static and interactive maps
✔ Learn the industry-transforming trendsRegardless of your skill level, you can equip yourself and h
PRP: 530.00 Lei
Acesta este Prețul Recomandat de Producător. Prețul de vânzare al produsului este afișat mai jos.
477.00Lei
477.00Lei
530.00 LeiLivrare in 2-4 saptamani
Descrierea produsului
Discover the techniques used by the top R programmers to generate data-driven solutions.Although the non-profit industry has advanced using CRMs and donor databases, it has not fully explored the data stored in those databases. Meanwhile, the data scientists, in the for-profit industry, using sophisticated tools, have generated data-driven results and effective solutions for several challenges in their organizations.Wouldn't you like to learn these data science techniques to solve fundraising problems?After reading Data Science for Fundraising, you can:
✔ Begin your data science journey with R
✔ Import data from Excel, text and CSV files, and databases, such as sqllite and Microsoft's SQL Server
✔ Apply data cleanup techniques to remove unnecessary characters and whitespace
✔ Manipulate data by removing, renaming, and ordering rows and columns
✔ Join data frames using dplyr
✔ Perform Exploratory Data Analysis by creating box-plots, histograms, and Q-Q plots
✔ Understand effective data visualization principles, best practices, and techniques
✔ Use the right chart type after understanding the advantages and disadvantages of different chart types
✔ Create beautiful maps by ZIP code, county, and state
✔ Overlay maps with your own data
✔ Create elegant data visualizations, such as heat maps, slopegraphs, and animated charts
✔ Become a data visualization expert
✔ Create Recency, Frequency, Monetary (RFM) models
✔ Build predictive models using machine learning techniques, such as K-nearest neighbor, Naive Bayes, decision trees, random forests, gradient boosting, and neural network
✔ Build deep learning neural network models using TensorFlow
✔ Predict next transaction amount using regression and machine learning techniques, such as neural networks and quantile regression
✔ Segment prospects using clustering and association rule mining
✔ Scrape data off the web and create beautiful reports from that data
✔ Predict sentiment using text mining and Twitter data
✔ Analyze social network data using measures, such as betweenness, centrality, and degrees
✔ Visualize social networks by building beautiful static and interactive maps
✔ Learn the industry-transforming trendsRegardless of your skill level, you can equip yourself and h
Detaliile produsului


