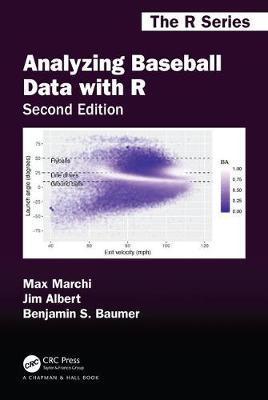
Analyzing Baseball Data with R, Second Edition

Analyzing Baseball Data with R, Second Edition
The authors first present an overview of publicly available baseball datasets and a gentle introduction to the type of data structures and exploratory and data management capabilities of R. They also cover the ggplot2 graphics functions and employ a tidyverse-friendly workflow throughout. Much of the book illustrates the use of R through popular sabermetrics topics, including the Pythagorean formula, runs expectancy, catcher framing, career trajectories, simulation of games and seasons, patterns of streaky behavior of players, and launch angles and exit velocities. All the datasets and R code used in the text are available online.
New to the second edition are a systematic adoption of the tidyverse and incorporation of Statcast player tracking data (made available by Baseball Savant). All code from the first edition has been revised according to the principles of the tidyverse. Tidyverse packages, including dplyr, ggplot2, tidyr, purrr, and broom are emphasized throughout the book. Two entirely new chapters are made possible by the availability of Statcast data: one explores the notion of catcher framing ability, and the other uses launch angle and exit velocity to estimate the probability of a home run. Through the book's various examples, you will learn about modern sabermetrics and how to conduct your own baseball analyses.
Max Marchi is a Baseball Analytics Analyst for the Cleveland Indians. He was a regular contributor to The Hardball Times and Baseball Prospectus websites and previously consulted for other MLB clubs.
PRP: 480.44 Lei
Acesta este Pretul Recomandat de Producator. Pretul de vanzare al produsului este afisat mai jos.
432.40Lei
432.40Lei
480.44 LeiLivrare in 2-4 saptamani
Descrierea produsului
The authors first present an overview of publicly available baseball datasets and a gentle introduction to the type of data structures and exploratory and data management capabilities of R. They also cover the ggplot2 graphics functions and employ a tidyverse-friendly workflow throughout. Much of the book illustrates the use of R through popular sabermetrics topics, including the Pythagorean formula, runs expectancy, catcher framing, career trajectories, simulation of games and seasons, patterns of streaky behavior of players, and launch angles and exit velocities. All the datasets and R code used in the text are available online.
New to the second edition are a systematic adoption of the tidyverse and incorporation of Statcast player tracking data (made available by Baseball Savant). All code from the first edition has been revised according to the principles of the tidyverse. Tidyverse packages, including dplyr, ggplot2, tidyr, purrr, and broom are emphasized throughout the book. Two entirely new chapters are made possible by the availability of Statcast data: one explores the notion of catcher framing ability, and the other uses launch angle and exit velocity to estimate the probability of a home run. Through the book's various examples, you will learn about modern sabermetrics and how to conduct your own baseball analyses.
Max Marchi is a Baseball Analytics Analyst for the Cleveland Indians. He was a regular contributor to The Hardball Times and Baseball Prospectus websites and previously consulted for other MLB clubs.
Detaliile produsului


